
Quant Notes | Data Interpretation
Here, in this section, we will provide you with notes to solve different types of data interpretation.
Let us see one by one-
1. Pie Chart DI
2. Line Chart DI
3. Bar Chart DI
4. Mix Graph DI
1. Pie Chart Questions in DI? Tips & Tricks
Pie graphs are circular shaped graphs which are divided into sectors or slices to represent numerical data. In a pie chart, the length or the central angle of each sector or slice is proportional to the quantity it represents.
Pie chart formulas and Important points:
Total angle at the center of a pie chart = 360°
To convert x% into angle = (x/100) × 360 e.g. for 10 %, (10/100) x 360=360°
i.e. 10% forms a 36° Angle at the center and vice-versa.
To convert m° into percentage = (m/360) ×100
Q1. Analyze the following pie chart and answer the questions given below. Given is the distribution of the monthly family budget of a person X. The total earnings of person X are Rs. 3,600 per month basis, plus 10% as transport and meal allowance on the monthly salary.

3. What is the approximate earning left of person X (in Rupees) per month after deducting payment of education and maintenance?
1. 3049.2 p.m.
2. 2,591p.m
3. 2,355 p.m.
4. 2,350 p.m
Solution:
4. What is the total amount per month the family spends on house rent and statutory deductions towards PF expenses?
1. Rs. 1,100
2. Rs. 1,259
3. Rs. 1,188
4. Rs. 1,140
Solution:
Q2. Study the following graph carefully & answer the questions given below it.
The pie chart given below shows the break-up of the cost of construction of a house (in degrees). Assuming that the total cost of construction is Rs. 60000, answer the questions given below.

1. The amount spent on labor exceeds the amount spent on steel by
1. 5% of the total cost
2. 10% of the total cost
3. 12% of the total cost
4. 15% of the total cost
5. None of these
Correct Option: B
Amount spent on labor
= 90 × 60000 / 360= Rs. 15000
Amount spent on steel
= Rs. 54 × 60000 / 360= Rs. 9000
Difference = 15000 - 9000 = Rs. 6000
i.e., 10% of the total cost.
Hence, option B is correct.
2. The amount spent on cement is
Solution:
Correct Option: C
Total cost = Rs. 60000
Amount spent on cement
= Rs. 72 × 60000 / 360 = Rs. 12000
Hence, option C is correct.
3. The amount spent on cement, steel, and supervision is what percent of the total cost of construction?
1. 40%
2. 45%
3. 50%
4. 55%
5. None of these
Solution:
Correct Option: C
Amount spent on cement steel and supervision
= (72 + 54 + 54) × 100% / 360
∴ Required percentage
= 180 × 100% / 360 = 50%
Hence, option C is correct.
4. The amount spent on labor exceeds the amount spent on supervision by
1. Rs. 200000
2. Rs. 160000
3. Rs. 120000
4. Rs. 6000
5. None of these
Solution:
The difference in an angle of labor and supervisors = 90° - 54° = 36°
∴ Amount = 36° × 60000 / 360°= 6000.
Hence, option D is correct.
2. Line Chart Questions in DI? Concepts & Tips

Q3. Study the following line graph and answer the questions based on it.
Number of Vehicles Manufactured by Two companies over the Years (Number in Thousands)
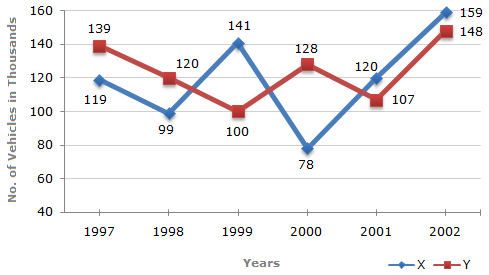
1. In which of the following years, the difference between the productions of Companies X and Y was the maximum among the given years?
1. 1997
2. 1998
3. 1999
4. 2000
5. None of these
Solution:The difference between the productions of Companies X and Y in various years are:
For 1997 (139000 - 119000) = 20000.
For 1998 (120000 - 99000) = 21000.
For 1999 (141000 - 100000) = 41000.
For 2000 (128000 - 78000) = 50000.
For 2001 (120000 - 107000) = 13000.
For 2002 (159000 - 148000) = 11000.
Clearly, the maximum difference was in 2000.
2. What is the difference between the number of vehicles manufactured by Company Y in 2000 and 2001?
1. 50000
2. 42000
3. 33000
4. 21000
5. None of these
Solution:
Required difference = (128000 - 107000) = 21000.
3. What is the difference between the total productions of the two Companies in the given years?
1. 19000
2. 22000
3. 26000
4. 28000
5. None of these
Solution:
From the line-graph, it is clear that the productions of Company X in the years 1997, 1998, 1999, 2000, 2001 and 2002 are 119000, 99000, 141000, 78000, 120000 and 159000 and those of Company Y are 139000, 120000,100000, 128000, 107000 and 148000 respectively.
Total production of Company X from 1997 to 2002
= 119000 + 99000 + 141000 + 78000 + 120000 + 159000
= 716000.
and total production of Company Y from 1997 to 2002
= 139000 + 120000 + 100000 + 128000 + 107000 + 148000
= 742000.
Difference = (742000 - 716000) = 26000.
4. The production of Company Y in 2000 was approximately what percent of the production of Company X in the same year?
1. 173
2. 164
3. 132
4. 97
5. None of these
Solution:
Required percentage = 128000 x 100% /78000 = 164%.
Let us see one by one-
1. Pie Chart DI
2. Line Chart DI
3. Bar Chart DI
4. Mix Graph DI
1. Pie Chart Questions in DI? Tips & Tricks
Pie graphs are circular shaped graphs which are divided into sectors or slices to represent numerical data. In a pie chart, the length or the central angle of each sector or slice is proportional to the quantity it represents.
Pie chart formulas and Important points:
Total angle at the center of a pie chart = 360°
To convert x% into angle = (x/100) × 360 e.g. for 10 %, (10/100) x 360=360°
i.e. 10% forms a 36° Angle at the center and vice-versa.
To convert m° into percentage = (m/360) ×100
Q1. Analyze the following pie chart and answer the questions given below. Given is the distribution of the monthly family budget of a person X. The total earnings of person X are Rs. 3,600 per month basis, plus 10% as transport and meal allowance on the monthly salary.
1. Calculate the amount of expenditure on Education and Maintenance per month, if a person X pays 23% of its total earnings as Education and Maintenance of children?
1. Rs. 910.8
2. Rs. 900
3. Rs. 920
4. Rs. 915
Solution:
1. Rs. 910.8
2. Rs. 900
3. Rs. 920
4. Rs. 915
Solution:
Total Emoluments = 3600+ 10% of 3600 = Rs. 3960
23% of 3960 = Rs. 910.8
23% of 3960 = Rs. 910.8
2. What is the medical and miscellaneous expenditure per annum (in Rs)?
1. 4,854
2. 5,330.16
3. 6177.6
4. 4,485.6
Solution:
1. 4,854
2. 5,330.16
3. 6177.6
4. 4,485.6
Solution:
Total Emoluments = 3600+ 10% of 3600 = Rs. 3960
Medical and Miscellaneous expenditure of total Salary
= 13% of Rs. 3960 = Rs.514.8
Expenditure per annum = Rs. 514.8 × 12 = Rs. 6177.6.
Medical and Miscellaneous expenditure of total Salary
= 13% of Rs. 3960 = Rs.514.8
Expenditure per annum = Rs. 514.8 × 12 = Rs. 6177.6.
3. What is the approximate earning left of person X (in Rupees) per month after deducting payment of education and maintenance?
1. 3049.2 p.m.
2. 2,591p.m
3. 2,355 p.m.
4. 2,350 p.m
Solution:
Total Emoluments = 3600+ 10% of 3600 = Rs. 3960
Education and Maintenance of children =23% of 3960 = Rs. 910.8
Take-Home Pay Packet = Rs. 3960 - 910.8
= Rs. 3049.2
Education and Maintenance of children =23% of 3960 = Rs. 910.8
Take-Home Pay Packet = Rs. 3960 - 910.8
= Rs. 3049.2
4. What is the total amount per month the family spends on house rent and statutory deductions towards PF expenses?
1. Rs. 1,100
2. Rs. 1,259
3. Rs. 1,188
4. Rs. 1,140
Solution:
Expenditure on house = Rs. 712.8
Expenditure on statutory deductions towards PF expenses=475.2
⇒ Total on both = 712.8 + 475.2 = 1188
Expenditure on statutory deductions towards PF expenses=475.2
⇒ Total on both = 712.8 + 475.2 = 1188
Q2. Study the following graph carefully & answer the questions given below it.
The pie chart given below shows the break-up of the cost of construction of a house (in degrees). Assuming that the total cost of construction is Rs. 60000, answer the questions given below.

1. The amount spent on labor exceeds the amount spent on steel by
1. 5% of the total cost
2. 10% of the total cost
3. 12% of the total cost
4. 15% of the total cost
5. None of these
Correct Option: B
Amount spent on labor
= 90 × 60000 / 360= Rs. 15000
Amount spent on steel
= Rs. 54 × 60000 / 360= Rs. 9000
Difference = 15000 - 9000 = Rs. 6000
i.e., 10% of the total cost.
Hence, option B is correct.
2. The amount spent on cement is
Solution:
Correct Option: C
Total cost = Rs. 60000
Amount spent on cement
= Rs. 72 × 60000 / 360 = Rs. 12000
Hence, option C is correct.
3. The amount spent on cement, steel, and supervision is what percent of the total cost of construction?
1. 40%
2. 45%
3. 50%
4. 55%
5. None of these
Solution:
Correct Option: C
Amount spent on cement steel and supervision
= (72 + 54 + 54) × 100% / 360
∴ Required percentage
= 180 × 100% / 360 = 50%
Hence, option C is correct.
4. The amount spent on labor exceeds the amount spent on supervision by
1. Rs. 200000
2. Rs. 160000
3. Rs. 120000
4. Rs. 6000
5. None of these
Solution:
The difference in an angle of labor and supervisors = 90° - 54° = 36°
∴ Amount = 36° × 60000 / 360°= 6000.
Hence, option D is correct.
2. Line Chart Questions in DI? Concepts & Tips
Q3. Study the following line graph and answer the questions based on it.
Number of Vehicles Manufactured by Two companies over the Years (Number in Thousands)
1. In which of the following years, the difference between the productions of Companies X and Y was the maximum among the given years?
1. 1997
2. 1998
3. 1999
4. 2000
5. None of these
Solution:The difference between the productions of Companies X and Y in various years are:
For 1997 (139000 - 119000) = 20000.
For 1998 (120000 - 99000) = 21000.
For 1999 (141000 - 100000) = 41000.
For 2000 (128000 - 78000) = 50000.
For 2001 (120000 - 107000) = 13000.
For 2002 (159000 - 148000) = 11000.
Clearly, the maximum difference was in 2000.
2. What is the difference between the number of vehicles manufactured by Company Y in 2000 and 2001?
1. 50000
2. 42000
3. 33000
4. 21000
5. None of these
Solution:
Required difference = (128000 - 107000) = 21000.
3. What is the difference between the total productions of the two Companies in the given years?
1. 19000
2. 22000
3. 26000
4. 28000
5. None of these
Solution:
From the line-graph, it is clear that the productions of Company X in the years 1997, 1998, 1999, 2000, 2001 and 2002 are 119000, 99000, 141000, 78000, 120000 and 159000 and those of Company Y are 139000, 120000,100000, 128000, 107000 and 148000 respectively.
Total production of Company X from 1997 to 2002
= 119000 + 99000 + 141000 + 78000 + 120000 + 159000
= 716000.
and total production of Company Y from 1997 to 2002
= 139000 + 120000 + 100000 + 128000 + 107000 + 148000
= 742000.
Difference = (742000 - 716000) = 26000.
4. The production of Company Y in 2000 was approximately what percent of the production of Company X in the same year?
1. 173
2. 164
3. 132
4. 97
5. None of these
Solution:
Required percentage = 128000 x 100% /78000 = 164%.
3. Bar Chart Questions in DI? Tips & Tricks
A Bar Graph is an outline that uses vertical or horizontal bars to demonstrate a comparison between various categories of information. There is two axis, one is horizontal i.e X-axis & another one is vertical i.e Y-axis. The X-Axis represents the categories being compared & Y-Axis describes the values of data for the respective category. Bar graphs can be represented in the form of either horizontal bars or vertical bars Questions based on these charts are commonly asked in competitive exams.
Q4. The bar graph given below shows the data of the production of paper (in lakh tonnes) by three different companies X, Y, and Z over the years.
Production of Paper (in lakh tonnes) by Three Companies X, Y and Z over the Years.
1. The average production for five years was maximum for which company?
1. X
2. Y
3. Z
4. X and Z both
5 None of these
Solution:

2. What is the ratio of the average production of Company X in the period 1998-2000 to the average production of Company Y in the same period?
1. 1:1
2. 15:17
3. 23:25
4. 27:29
5. None of these
Solution:

3. What is the difference between the production of Company Z in 1998 and Company Y in 1996?
1. 2,00,000 tons
2. 20,00,000 tons
3. 20,000 tons
4. 2,00,00,000 tons
5. None of these
Solution:
Required difference = [(45 - 25) x 1,00,000] tons
= 20,00,000 tons.
4. For which of the following years, the percentage rise/fall in production from the previous year is the maximum for Company Y?
1. 1997
2. 1998
3. 1999
4. 2000
5. None of these
Solution:

5. What is the percentage increase in the production of Company Y from 1996 to 1999?
1. 30%2. 45%
3. 50%
5. 60%
6. None of these
Solution:

4. Mix Graph DI
